Generating And Operating on Waveforms
Operations on waveforms operate in a pointwise manner. For the most part, the actual values of the x-axis (horizontal) are ignored. Exceptions are differentiation, integration, smoothing, and curve fitting, because the step size is significant. Some operations such as the FFT (Fast Fourier Transform) assume that the points are uniformly spaced.
The Waveform Generators
We encountered two of GF4’s waveform generators in the Quick Start section. There we used the ramp and Gaussian noise generators. Figure WA-1 depicts the generator command buttons:
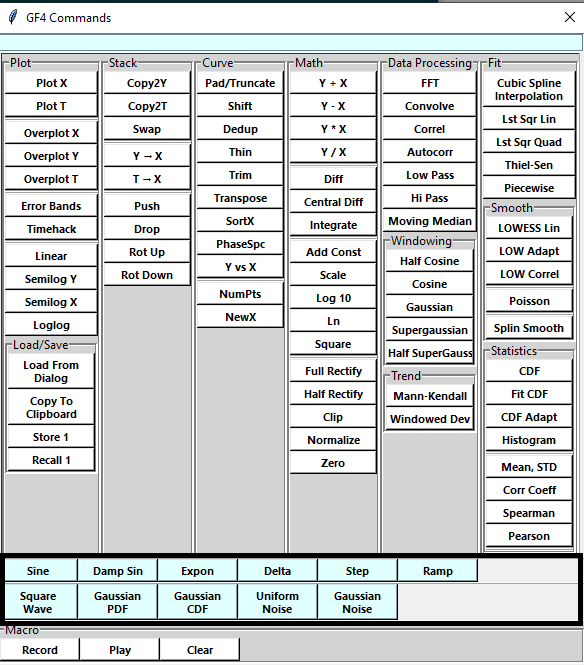
Figure WA-1. Waveform Generators.
The generated waveforms will contain a number of equally-spaced data points. The default number is 256. There is no provision for setting the x-axis scale: it can be changed afterwards using the NewX button. The number of points in a generated waveform can be set using the NumPts button. There is no specific limit to the number of points, but if it is too large, some operations on the dataset might take a long time.
Meaning of Parameters For Some Waveforms
Command |
Param |
Meaning or Scale |
|---|---|---|
Sine |
Cycles |
Number of cycles across the screen |
Damp Sin |
Cycles |
Number of cycles across the screen |
Damp Sin |
Decay |
Decay time constants across the screen |
Expon |
Decay |
Decay time constants across the screen |
Square Wave |
Cycles |
Number of cycles across the screen |
Gaussian PDF |
Mean |
Mean of the generated Gaussian distribution |
Gaussian PDF |
Sigma |
Standard Deviation of the generated Gaussian distribution |
Gaussian CDF |
Same as |
for Gaussian PDF |
Gaussian Noise |
Same as |
for Gaussian PDF |
The Uniform Noise command draws a random sample with equal probabilities in the range of 0 - 1.0. When not specified, the maximum height of a waveform is 1.0. If a different value is needed, the waveform can be scaled using the Scale button.
Operations On One Waveform
All operations on one waveform operate on the X (or Main) dataset. No other datasets are modified. The new or modified dataset is plotted. Some examples, among many others, are
Add Const
Differentiate
Full Rectify
Ln (the natural logarithm)
Log 10 (logarithm base 10)
LOWESS Lin
Scale
Transpose
Truncate
The Mean, STD button does not change the dataset. Instead, it displays some basic statistic values in a message band below the main plotting pane. The message reports the data maximum, mean, standard deviation, standard error, area, lag-one correlation coefficient 1, and number of data points. The values can be highlighted with the mouse and copied to the clipboard with <CTRL-C>
Here is a typical message:
Max: 0.500 at x=4.000 Mean: -0.0319 Span: 0.999 Std Dev: 0.2802 SE: 0.0175 area: -8.48e+00 rho: 0.047 N = 256
- 1
Gives an indication of short-range correlation in the data.
Operations On Two Waveforms
Operations on two waveforms operate on the X and Y datasets. The results replace the X dataset. No other datasets are modified. The result dataset is plotted. Currently the two-dataset operations are
Convolve (form the convolution of X and Y)
Correl (correlate X and Y)
Y + X (pointwise sum)
Y - X (pointwise difference)
Y * X (pointwise product)
Y / X (pointwise division)
Note that the four pointwise arithmetical operations require that both datasets have the same number of points. Pointwise division cannot succeed if any of the divisor’s points has a zero value: the operation is canceled, an error messsage is shown, and the original contents of X are unchanged.
There are three other operations between X and Y datasets that do not change the X dataset, because they result in a plain number -
Pearson (Pearson’s Correlation Coefficient)
Spearman (Spearman Rank Correlation Coefficient)
These display their results in a message bar below the plotting pane. The values can be highlighted with the mouse and copied to the clipboard with <CTRL-C>.